For details, please refer to the paper
Abstract
Smartphones offer a low-cost, widely accessible method for assessing pavement roughness, presenting an alternative to traditional instruments. This paper reviews the current knowledge on smartphone-based pavement roughness assessment and anomaly detection (AD). It identifies gaps in the existing research and proposes future directions. Key aspects of sensor selection, data preprocessing, and algorithm choices are discussed. Practical factors like data collection speed, vehicle type, and smartphone placement are considered to improve the robustness and accuracy of the method.
Introduction
Pavement deteriorates over time due to traffic loads and environmental conditions. Monitoring pavement conditions is crucial for ensuring road safety, ride comfort, and cost-efficient maintenance. Traditionally, roughness indices like the International Roughness Index (IRI) are measured using costly inertial profilers. This paper explores the potential of using smartphones, which can crowdsource data from drivers, providing a more affordable, scalable solution.
Review Methodology
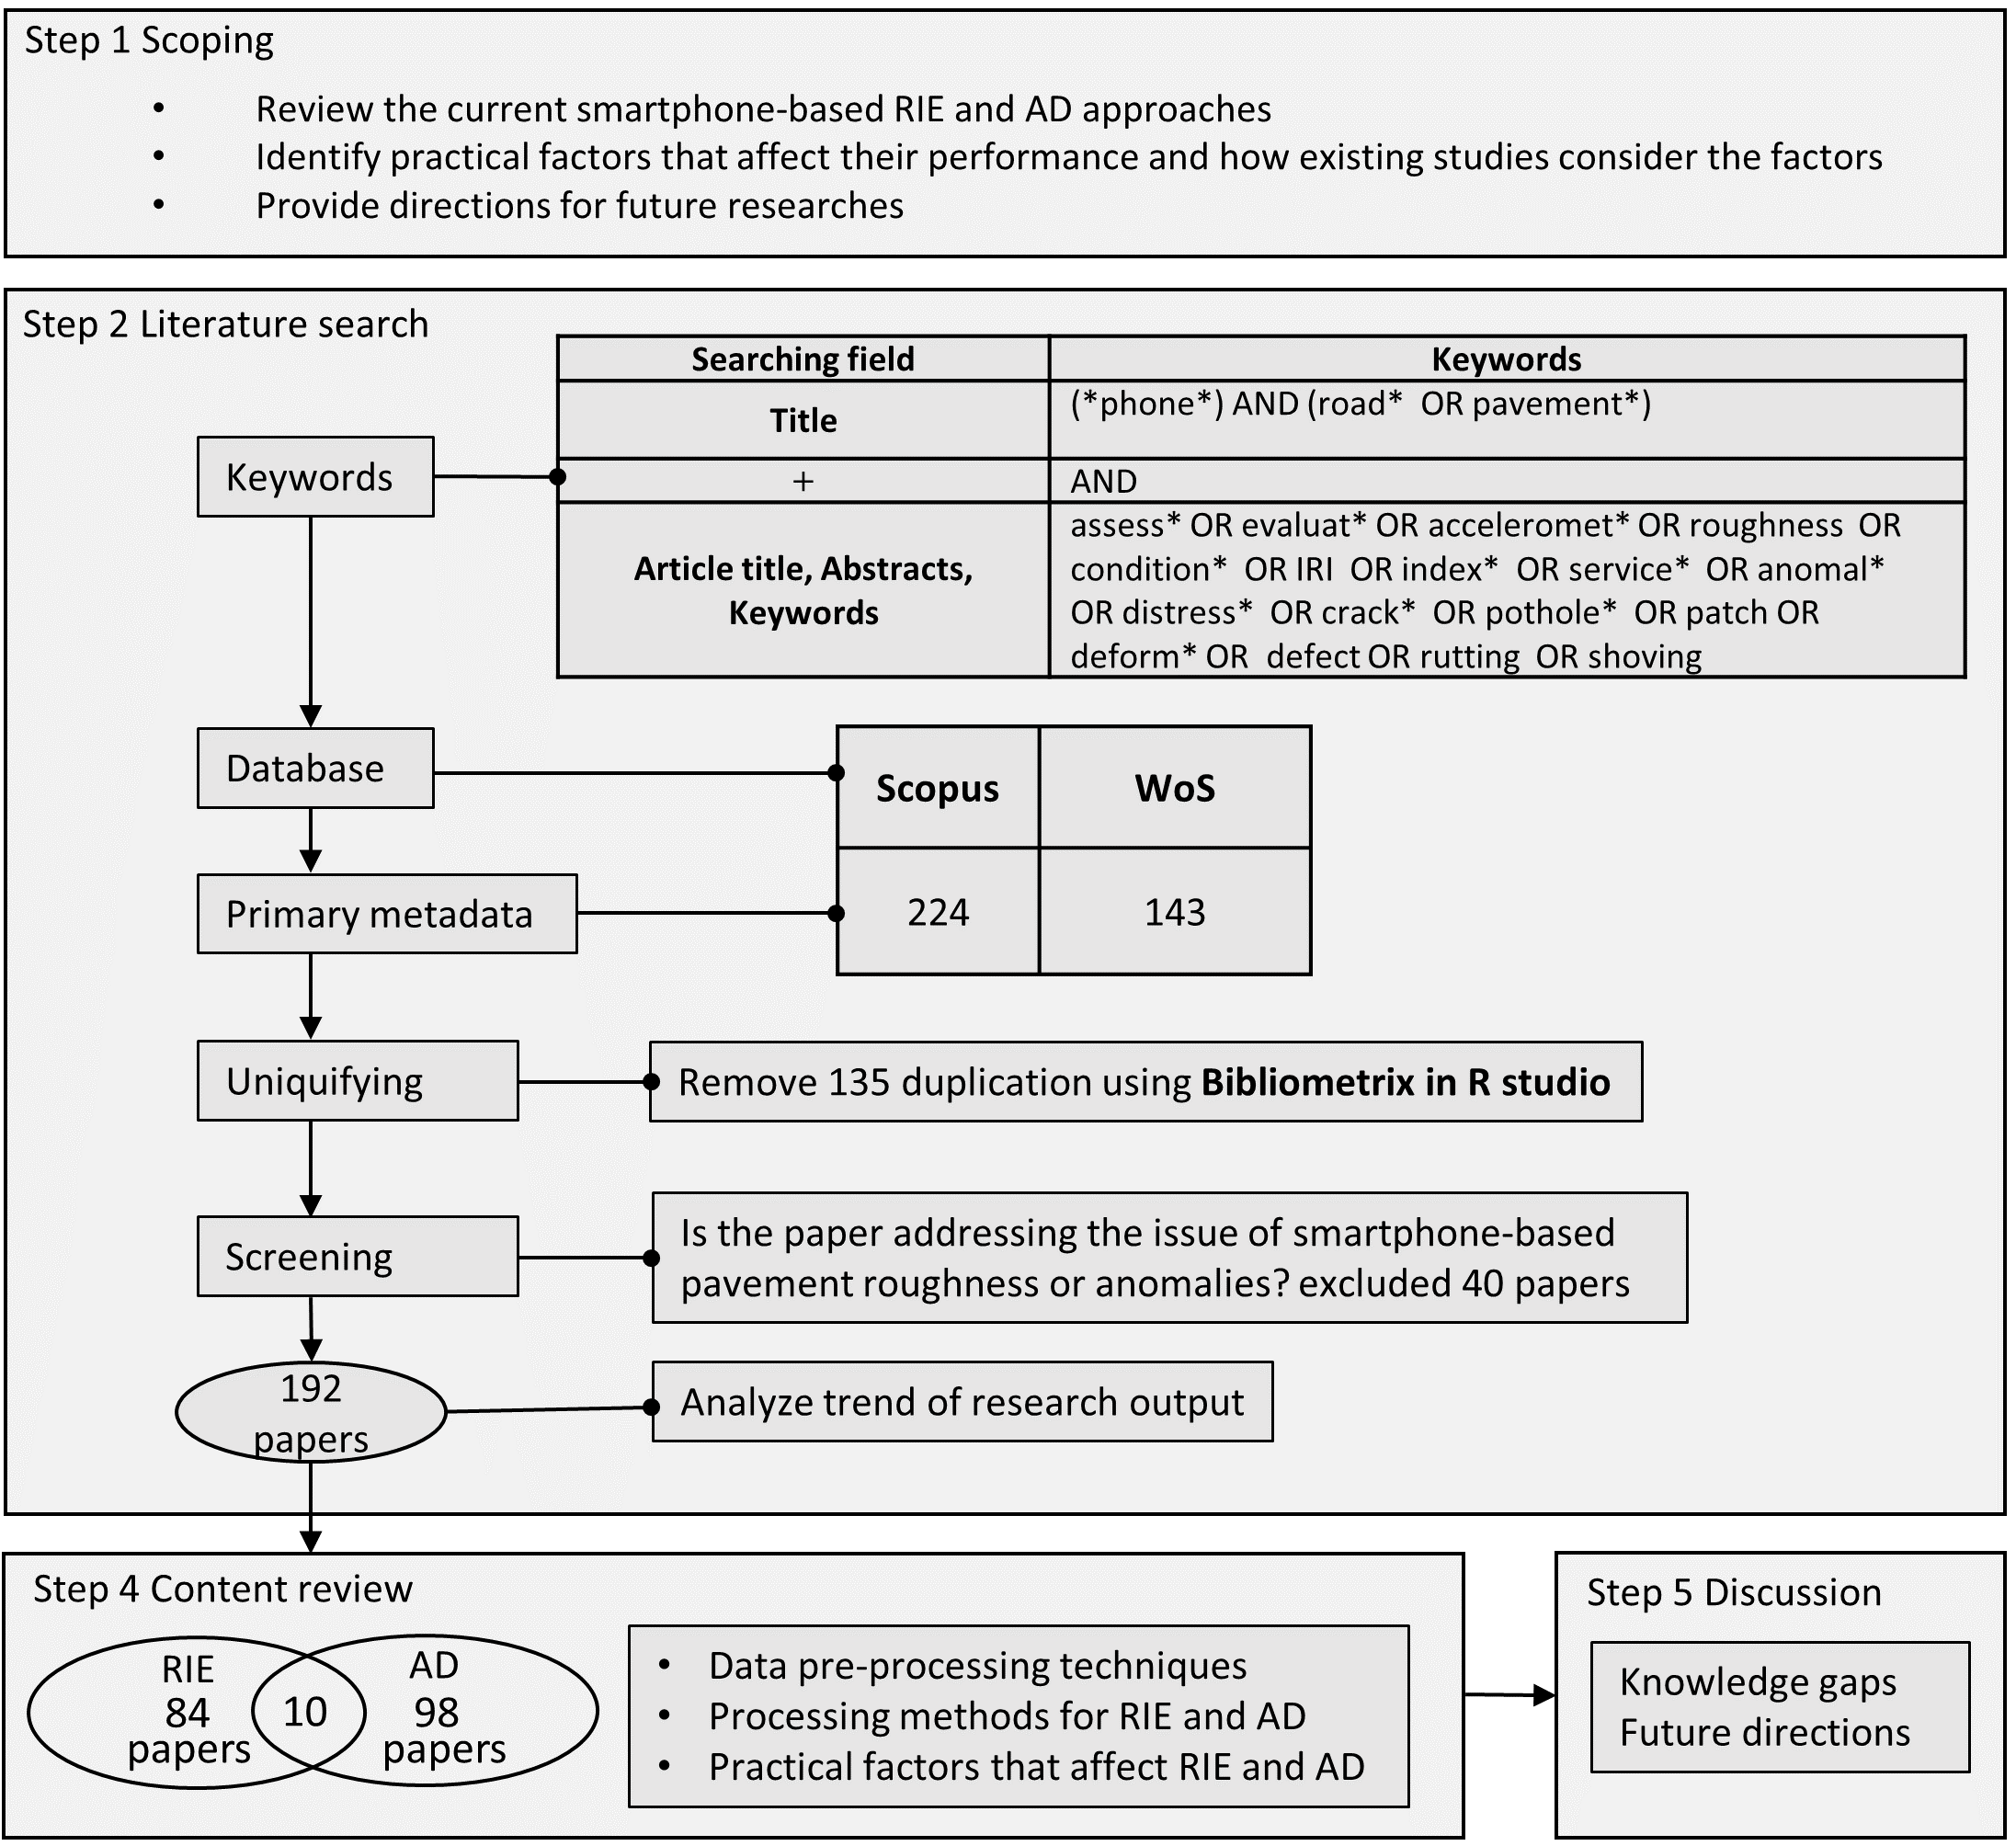
The paper adopts a systematic review methodology, incorporating five key steps:
- Scoping
- Searching
- Bibliometric Analysis
- Content Review
- Discussion
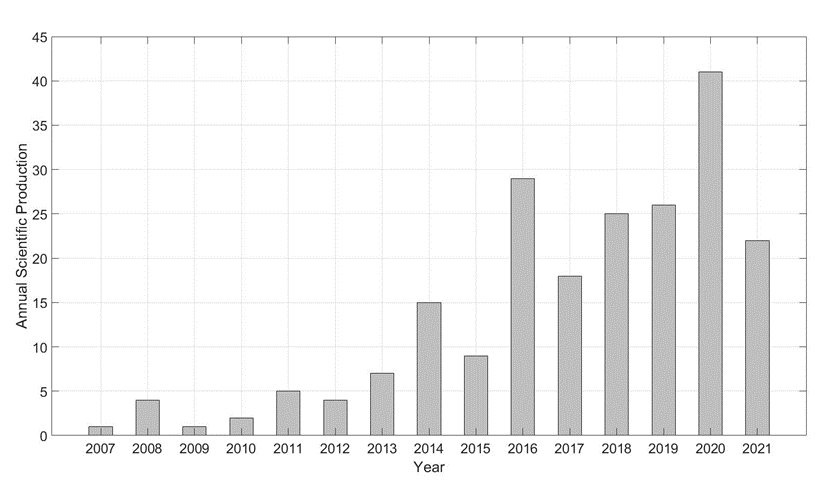
A literature search across two databases (Web of Science, Scopus) yielded 192 relevant publications. The earliest research dates back to 2007, with a growing trend in recent years.

Literature Search
Key topics covered in the literature include:
- Accelerometer: Used to capture vehicle movement caused by road roughness.
- Pavement distress types: Cracking, rutting, potholes, and other anomalies.
The paper outlines Boolean operators and wildcard techniques used to refine the literature search. The analysis revealed an average annual growth rate of 11% in research related to smartphone-based pavement assessments.

Sensor Selection and Data Pre-Processing
4.1. Sensor Axis Selection
Smartphones contain accelerometers and gyroscopes that measure linear and rotational motion in multiple axes. Different combinations of axes are used for Roughness Index Estimation (RIE) and Anomaly Detection (AD). For instance, vertical acceleration is often employed to detect bumps and potholes, while lateral axes help distinguish between various surface anomalies.

4.2. Data Filtering
Pre-processing techniques like low-pass and high-pass filters help eliminate noise from raw data, such as engine vibrations or vehicle maneuvers. Simple Moving Average (SMA) filters are also used to smooth acceleration data.
Methods for Roughness Index Estimation
5.1. IRI Estimation
The IRI is a widely accepted metric for pavement roughness. Smartphones can estimate IRI using three main methods:
- Statistical Methods: Correlate acceleration data with IRI via regression analysis.
- Vehicle Model-Based Methods: Estimate IRI by simulating vehicle suspension models.
- Machine Learning (ML) Methods: Use algorithms like Artificial Neural Networks (ANN) to predict roughness indices from sensor data.
5.2. Estimation of Other Roughness Indices
Beyond the IRI, other indices such as the Pavement Condition Index (PCI) and Pavement Serviceability Index (PSI) are discussed.
Methods for Anomaly Detection
6.1. Acceleration Threshold and Pattern Methods
Road anomalies like potholes can be detected by comparing acceleration data to predefined thresholds. Alternatively, pattern-based methods like Dynamic Time Warping (DTW) identify anomalies by comparing the signal pattern against known patterns, making them robust to speed variations.
6.2. Classification-Based Methods
Machine learning models can classify anomalies using features extracted from the acceleration signal. Support Vector Machines (SVM), Random Forest (RF), and Convolutional Neural Networks (CNN) are commonly used for this purpose.
6.3. Vision-Based Methods
Smartphone cameras complement accelerometer data to detect anomalies like cracks, which do not always produce significant vibrations.
Factors Affecting Accuracy
Smartphone-based methods are influenced by several factors, including:
- Vehicle speed: Higher speeds generate stronger acceleration signals.
- Vehicle type: Different vehicle models produce varying responses to road roughness.
- Smartphone mounting: The orientation and placement of the phone affect sensor data accuracy.
Knowledge Gaps and Future Directions
Despite the progress made, several challenges remain:
- More robust models that account for varying driving speeds, vehicle types, and phone placements are needed.
- Combining accelerometer data with vision-based approaches could improve detection accuracy.
- Further research is required to evaluate smartphone-based systems in real-world settings.